
News
Which Leeds United manager had the best points-per-game record?
Don Revie has the best points-per-game record among Leeds United managers with at least 20 competitive matches in the supplied dataset, averaging 1.87 across 741 games.
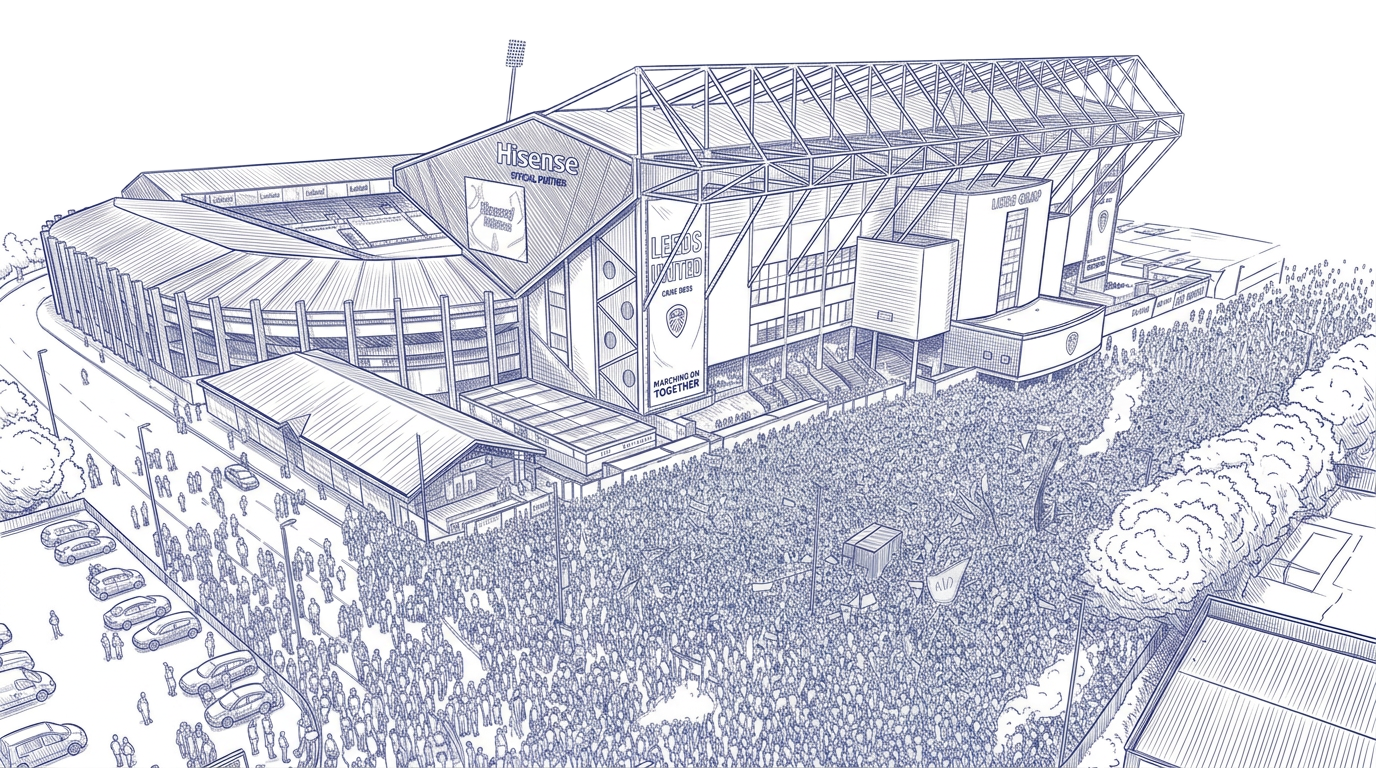

The answer: Don Revie, with 1.87 points per game
Don Revie has the best points-per-game record among Leeds United managers who have managed at least 20 competitive matches in the supplied dataset. Revie's record is 395 wins, 197 draws and 149 defeats across 741 matches. Applying the modern three-points-for-a-win system retrospectively gives him an average of 1.87 points per game.
Points per game is useful because it allows managers' records to be compared across different numbers of matches. A manager who wins 20 games from 30 matches might have a better average than one who wins 100 from 200. It is not a complete measure of managerial quality, but it gives a consistent starting point.
The calculation used here is straightforward: three points for each win, one for each draw, zero for each defeat, divided by the number of matches. That normalises the points system across eras, including seasons when a win was worth only two points. It is a comparison method, not a claim that Revie's league tables originally awarded three points for a win.
The leading Leeds managers by points per game
| Rank | Manager | Matches | W | D | L | Win rate | Points per game |
|---|---|---|---|---|---|---|---|
| 1 | Don Revie | 741 | 395 | 197 | 149 | 53.3% | 1.87 |
| 2 | Daniel Farke | 148 | 74 | 42 | 32 | 50.0% | 1.78 |
| 3 | Simon Grayson | 169 | 84 | 40 | 45 | 49.7% | 1.73 |
| 4 | David O'Leary | 203 | 101 | 47 | 55 | 49.8% | 1.72 |
| 5 | Gary McAllister | 50 | 25 | 8 | 17 | 50.0% | 1.66 |
| 6 | Garry Monk | 53 | 25 | 11 | 17 | 47.2% | 1.62 |
| 7 | Marcelo Bielsa | 170 | 81 | 30 | 59 | 47.6% | 1.61 |
| 8 | Jimmy Armfield | 193 | 87 | 47 | 59 | 45.1% | 1.60 |
| 9 | Howard Wilkinson | 411 | 178 | 117 | 116 | 43.3% | 1.58 |
The leaderboard should be read as a set of records, not a final verdict on who was the “best” Leeds manager. These men worked in different divisions, under different owners and with different resources. The match totals also vary widely. Revie's record stretches across the building of a side that became a domestic and European power; Gary McAllister's 50 matches represent a far smaller sample.
Revie's lead is significant because it combines a high average with exceptional longevity. A short run of favourable results can produce an impressive points-per-game figure, but maintaining a return of 1.87 across 741 matches is another matter. The record includes seasons of promotion, league title races, cup campaigns and the pressures that come with managing a club expected to win.
Revie's great advantage: consistency over years
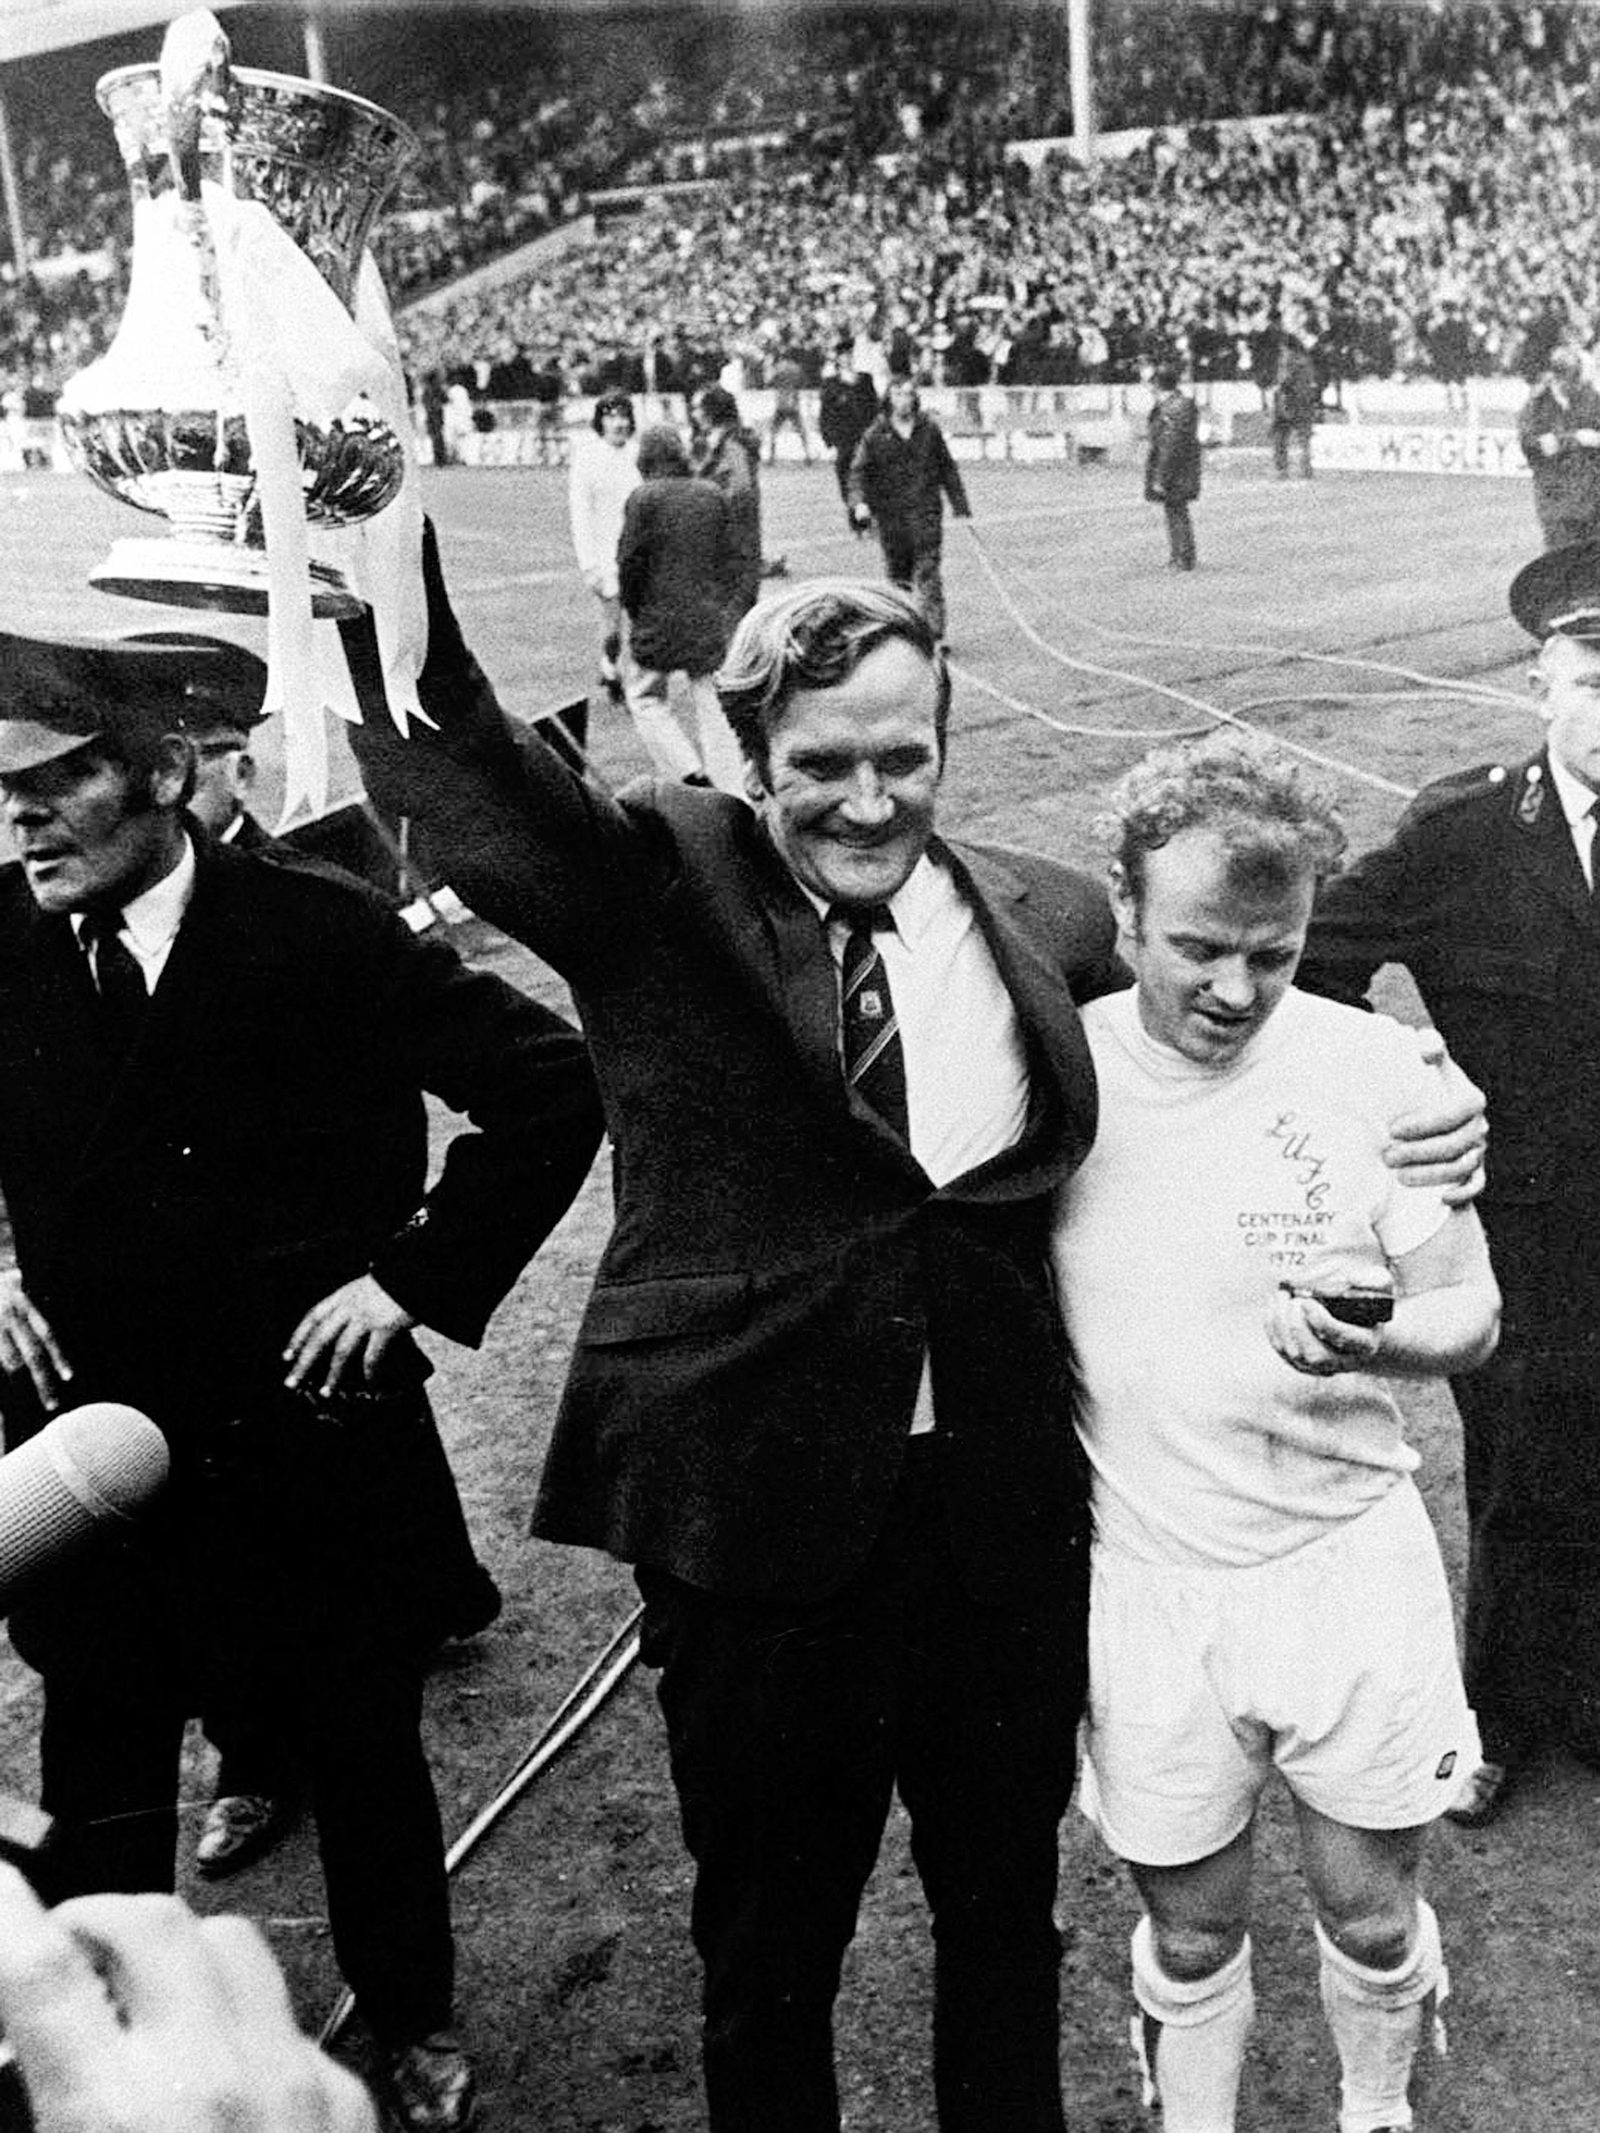
Revie's tenure transformed Leeds from a struggling Second Division club into one of the defining teams of English football. He won two First Division titles and a series of domestic and European trophies, but his significance goes beyond the silverware. He assembled a squad with clear roles, developed a strong collective culture and kept the team competitive over a long period.
The raw figures make that sustained performance visible. With 395 wins from 741 matches, Revie won more than half of the matches in the supplied record. His 197 draws are a reminder that the two-point era and the tactical demands of his time created a different match environment, but the overall record remains exceptional when translated into the same modern points formula used for everyone else.
It is also worth noting that Revie's legacy cannot be captured by PPG alone. The manager who wins one promotion campaign and leaves a club in a healthier condition may have made a greater contribution than a points average suggests. Likewise, the manager who keeps Leeds competitive in the top flight faces different challenges from one rebuilding in League One or the Championship.
Modern success, viewed through a different lens
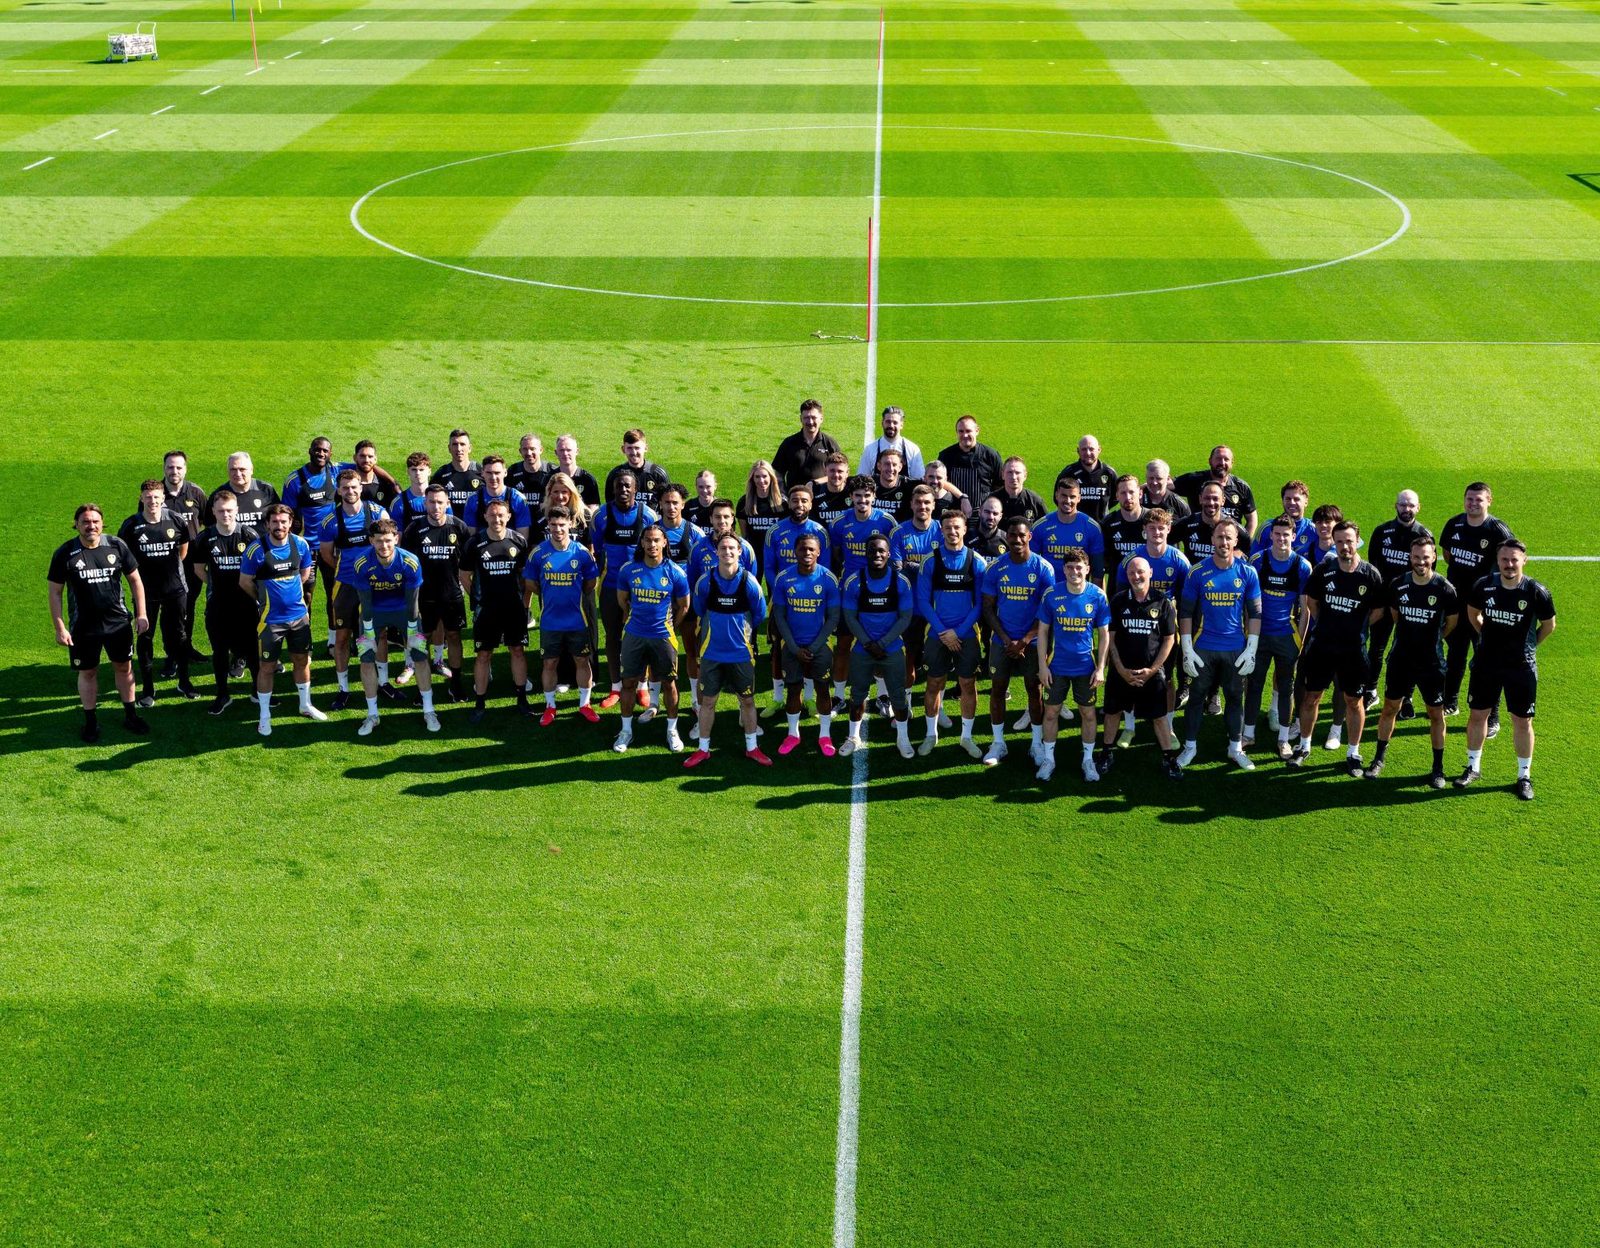
Daniel Farke ranks second in the supplied table at 1.78 PPG, with 148 matches and a 50% win rate. His return reflects the different demands of modern Leeds, including promotion pressure and the financial and sporting consequences of movement between the Premier League and Championship. The figure is a snapshot of the manager data supplied, rather than a timeless career total; if the archive updates, the number will change.
Simon Grayson and David O'Leary follow closely. Grayson's 1.73 includes the period when Leeds moved out of League One, while O'Leary's 1.72 came during the rise of the young team that reached the Champions League semi-finals. Their tenures were very different, but both delivered periods when Leeds won regularly and the club's ambitions were expanding.
Gary McAllister and Garry Monk also rank highly, although their samples are much smaller. McAllister's 1.66 across 50 games is a good example of why the minimum-games threshold matters. A strong run over 20 or 50 matches can be valuable, but the same average over several hundred matches is more robust.
Marcelo Bielsa's 1.61 reflects both a transformative Championship campaign and the demands of keeping Leeds in the Premier League. His teams produced one of the club's most distinctive modern football identities, but the PPG statistic includes difficult top-flight seasons as well as the record-breaking promotion. Points per game is descriptive; it does not explain tactical influence, injuries, ownership, recruitment or the emotional impact a manager has on supporters.
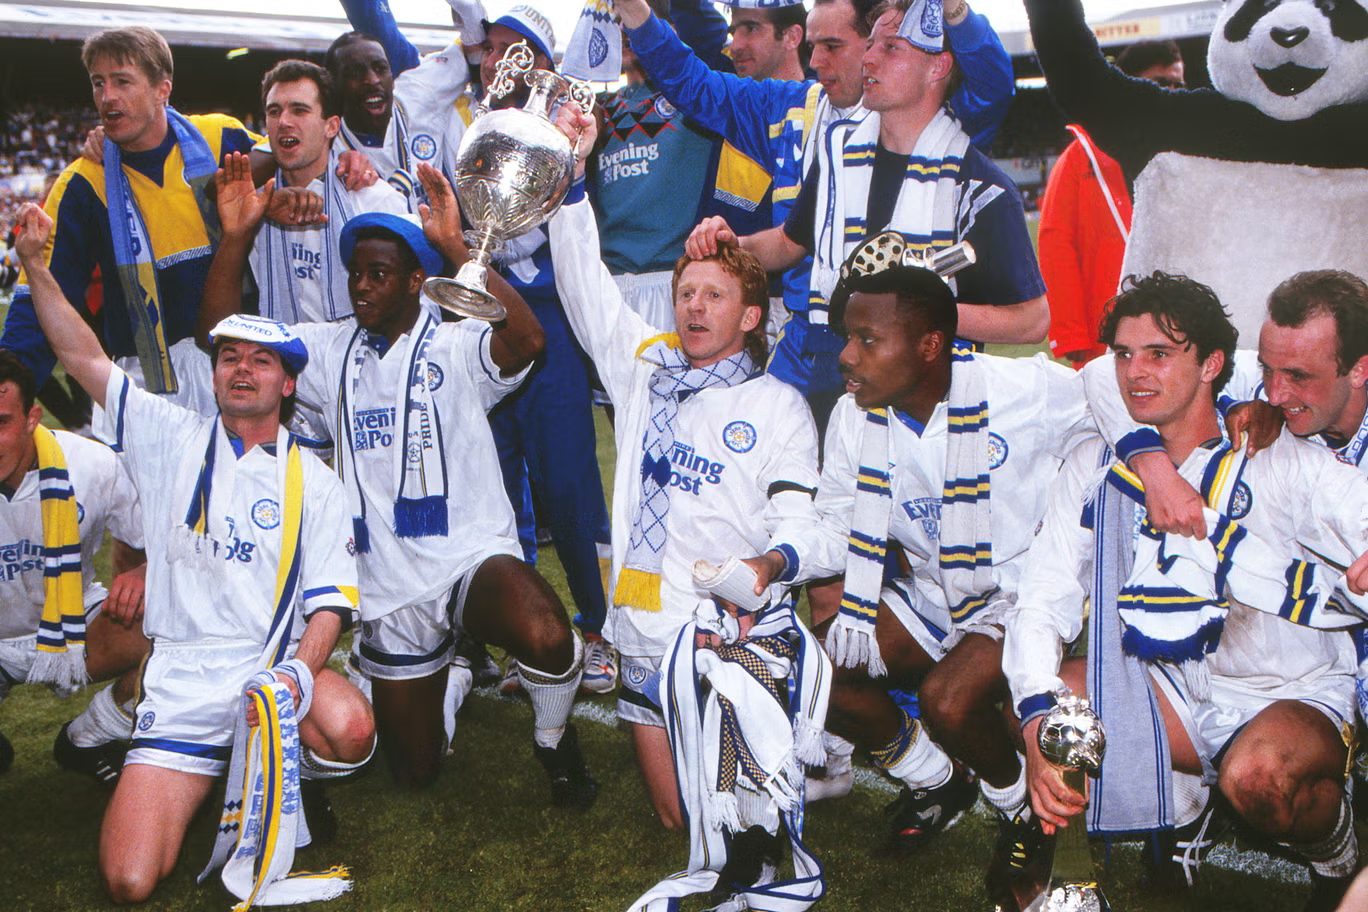
Howard Wilkinson's 1.58 may appear lower than some shorter modern tenures, but his record includes the rebuilding years, promotion from the Second Division and the 1991–92 title-winning campaign. He inherited a club far from its former status and made it champions of England. A leaderboard can tell us his average; it cannot make that achievement look ordinary.
Why win percentage and points per game are not the same
The table includes win percentage because supporters often use it as shorthand for managerial success. But a draw earns a point, and a manager who turns defeats into draws can achieve a stronger points average without increasing the number of wins. Under the three-point system, the PPG formula also recognises that each win is worth more than a draw.
There are other questions worth asking alongside PPG. What division did the team play in? Did the manager achieve promotion? Did they win a trophy? How many matches did they manage? What was the state of the squad when they arrived, and what state did they leave it in? The numbers are most helpful when they open these questions rather than close the conversation.
The fairest way to read the ranking
This article uses a threshold of at least 20 competitive matches, and a uniform three-points-for-a-win calculation. That makes the listed managers comparable within the same rules. It does not eliminate the differences in competition mix or appointment circumstances, and it does not include short caretaker spells that fall below the threshold.
For a fan archive, transparency is more useful than a supposedly definitive ranking. Every manager's record should link to a page showing games, wins, draws, defeats, PPG, win percentage, seasons, divisions, promotions and trophies. Readers can then choose their own measure of success.
The Numbers Behind verdict
Don Revie leads the supplied Leeds United manager dataset, with 1.87 points per game over 741 competitive matches. Daniel Farke is second on 1.78 in the supplied snapshot. The numbers underline Revie's consistency, but they are best understood alongside division, tenure, achievements and the context in which each manager worked.