
News
Which decade produced the most Leeds United victories?
Leeds United recorded 274 competitive victories in the 1960s, the highest decade total in the supplied dataset. The 1970s came close, finishing just nine wins behind.
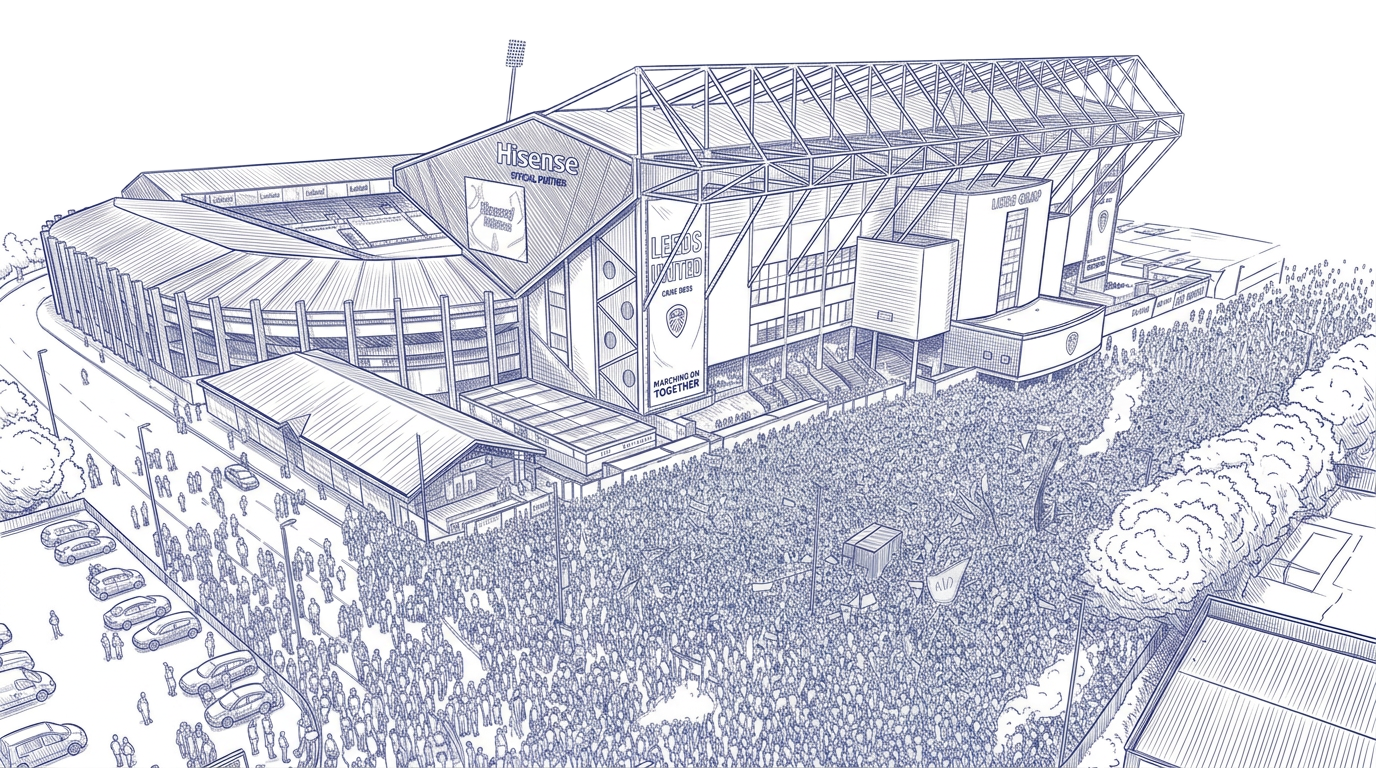
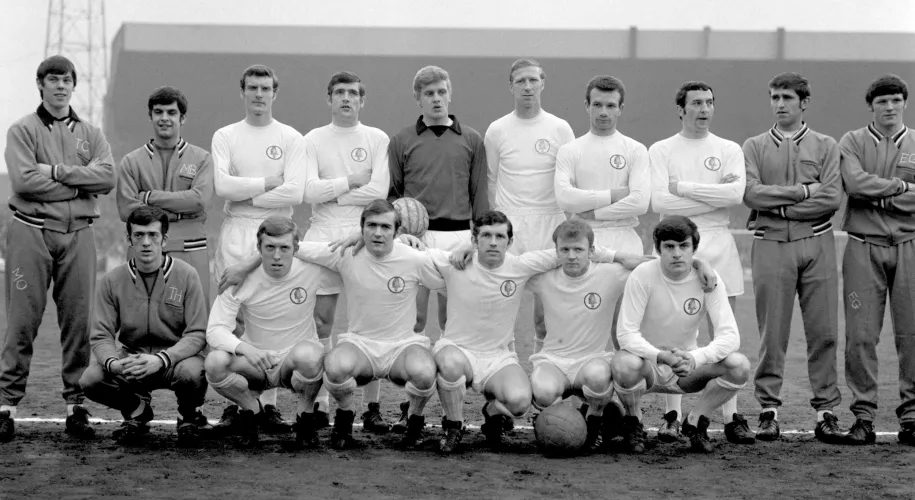
The answer: The 1960s, with 274 victories
The 1960s produced the most Leeds United competitive victories, with 274 wins from 535 matches in the supplied dataset. That is a win rate of 51.2%, with 923 goals scored and 599 conceded. The 1970s are a close second, with 265 wins from 551 matches, only nine fewer victories across the decade.
The result feels right for a club whose history was transformed in the 1960s. Leeds began the decade facing the threat of falling into the Third Division, then moved into the First Division, became regular title challengers, won their first major trophies and secured their first English championship in 1968–69. The statistics turn that extraordinary change into a clear numerical story: more than half of the recorded matches in the decade ended in a Leeds win.
But the 1970s show that the success did not stop at midnight on 31 December 1969. Leeds continued winning at a remarkable rate, earning a second First Division title, the FA Cup and another Fairs Cup, while also reaching major domestic and European finals. The decade ranking is a contest between two halves of the same golden period.
Leeds United's decades ranked by total victories
| Rank | Decade | Matches | Wins | Draws | Defeats | Goals for | Goals against | Win rate |
|---|---|---|---|---|---|---|---|---|
| 1 | 1960s | 535 | 274 | 134 | 127 | 923 | 599 | 51.2% |
| 2 | 1970s | 551 | 265 | 152 | 134 | 860 | 564 | 48.1% |
| 3 | 2000s | 523 | 228 | 121 | 174 | 736 | 624 | 43.6% |
| 4 | 1990s | 506 | 222 | 138 | 146 | 753 | 577 | 43.9% |
| 5 | 2010s | 514 | 209 | 118 | 187 | 712 | 678 | 40.7% |
| 6 | 1980s | 492 | 186 | 136 | 170 | Not supplied | Not supplied | 37.8% |
| 7 | 1950s | 439 | 177 | 107 | 155 | Not supplied | Not supplied | 40.3% |
| 8 | 1920s | 420 | 165 | 96 | 159 | Not supplied | Not supplied | 39.3% |
| 9 | 1930s | 420 | 157 | 97 | 166 | Not supplied | Not supplied | 37.4% |
| 10 | 2020s* | 306 | 128 | Not supplied | Not supplied | Not supplied | Not supplied | Ongoing |
| 11 | 1940s | 158 | 41 | Not supplied | Not supplied | Not supplied | Not supplied | War-disrupted decade |
The 2020s are incomplete in the supplied snapshot. The 1940s total reflects the disruption caused by the Second World War and is not directly comparable with a normal decade of league and cup football.
The table needs to be read in two ways. Raw wins place the 1960s first, but win percentage makes comparisons of efficiency possible. The 1970s' 48.1% remains outstanding, and the 2000s and 1990s are close in terms of win rate despite their different raw totals. The 2000s registered 228 wins to the 1990s' 222, partly because the number of matches played and the mix of divisions and competitions varied between the decades.
Why the 1960s changed everything
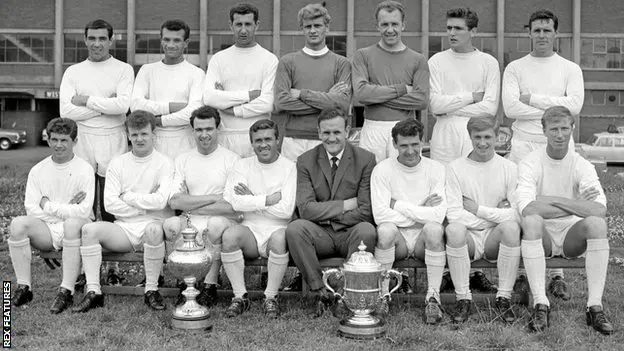
At the beginning of the decade, Leeds were not yet the national force they would become. Don Revie's arrival in 1961 marked the start of a rebuilding project that required more than a new formation or a handful of signings. The club's training, preparation, recruitment and collective mentality changed. Leeds won promotion in 1963–64 and quickly established themselves among the First Division's strongest sides.
The runners-up finishes of 1964–65 and 1965–66 were painful, but they were also evidence of the transformation. Leeds were consistently challenging the established powers, and in 1967–68 the team won the League Cup and the Inter-Cities Fairs Cup. The First Division title followed in 1968–69. The decade's 274 victories therefore reflect a sustained rise rather than a single trophy-winning season.
The +324 goal difference in the supplied record is another way to see that dominance. Leeds scored 923 goals and conceded 599 across 535 matches. The team did not merely edge a large number of results; its scoring and defensive balance produced a substantial overall margin.
The 1970s nearly matched it
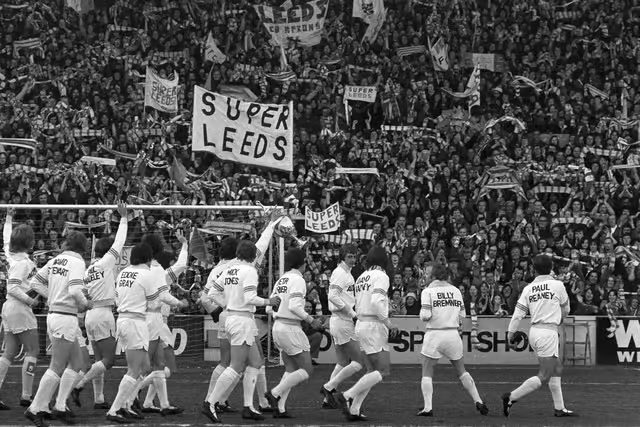
The 1970s produced 265 wins, just nine fewer than the 1960s. Leeds continued to challenge for honours and won their second league title in 1973–74. They also won the FA Cup in 1972 and the Fairs Cup in 1971. Yet the decade remains associated as much with what Leeds nearly won as with what they did win: runners-up finishes in the league, the 1973 FA Cup final defeat to Sunderland and the European final losses that still provoke debate among supporters.
That is what makes the nine-win gap so striking. The 1960s gave Leeds the ascent; the 1970s sustained the club at the top, even as Revie's side began to age and then broke apart after his departure. In football terms, the decade boundary is arbitrary. The team that won in 1969 did not reset on New Year's Day 1970, and the same footballing culture continued across the divide.
The 1990s and 2000s: Different reasons for winning
The 1990s recorded 222 victories, while the 2000s reached 228. These totals conceal quite different stories. The 1990s began with Howard Wilkinson returning Leeds to the top flight and winning the 1991–92 First Division title. The later decade included Premier League football, European qualification and the high point of reaching the Champions League semi-finals in 2001.
The 2000s, by contrast, include both the club's Champions League years and the difficult fall into League One. Leeds played many matches in the lower divisions, where league schedules and cup runs could alter the annual total. The decade's slightly higher win count should not be read as evidence that the club was more successful than in the 1990s. The number of wins is raw volume, not a ranking of trophies, league position or financial stability.
The 2010s and beyond
The 2010s brought 209 wins from 514 matches in the supplied record, a 40.7% win rate. The decade included the years in League One, a long Championship spell and the late emergence of the side that would return to the Premier League under Marcelo Bielsa. The 2020s figure is incomplete and continues to change as matches are played, so it should be treated as a live count rather than a settled decade record.
The older decades also require care. The 1920s and 1930s include Leeds' early years and periods in different divisions. The 1940s were profoundly disrupted by wartime football, with normal league competition suspended for years. The total of 41 wins from 158 recorded matches reflects that unusual context rather than a straightforward decade of football.
What a decade of wins can and cannot tell us
The 1960s win count tells us that Leeds were exceptionally productive across a long run of seasons. It does not by itself tell us which decade supporters enjoyed most, which team played the best football or which results mattered most. The same number of wins can be spread across relegation struggles, promotion campaigns, cup runs and title races.
That is why this article belongs in a database-led archive. The reader can start with the decade ranking, then open the seasons that explain it. The 1960s lead into Revie's rise; the 1970s explore the continuation of the golden era; the 1990s trace Wilkinson's championship; and the 2000s reveal how footballing results and club finances can move in very different directions.
The Numbers Behind verdict
Leeds won 274 competitive matches in the 1960s, the largest decade total in the supplied record. The 1970s came within nine victories. The ranking is based on total wins, so it should be read alongside win percentage, matches played and the footballing context of each decade.